
Instrumentation and Measurement Information
This page provides detailed information on Austin College Weather Station (ACWX) instrumentation and measurements. All equipment has been purchased from Campbell Scientific, a leading manufacturer of meteorological dataloggers and sensors. Much of the information contained on this web page originates from Campbell Scientific literature. Manuals from Campbell Scientific for each instrument are accessed by clicking on the highlighted link for each instrument (for example, the temperature and relativity humidity probe manual is available from the HMP50 link).
- Sneed Environmental Research Area Site Characteristics
- Time
- Meteorological Instrumentation and Measurements
- Soil Instrumentation and Measurements
- Energy Balance/Bowen Ratio Theory
- Energy Balance Instrumentation and Measurements
- Instrumentation Specifications
- Measurement Accuracy
- Power, Data Storage, and Telecommunications
- Additional Information
Sneed Environmental Research Area Site Characteristics
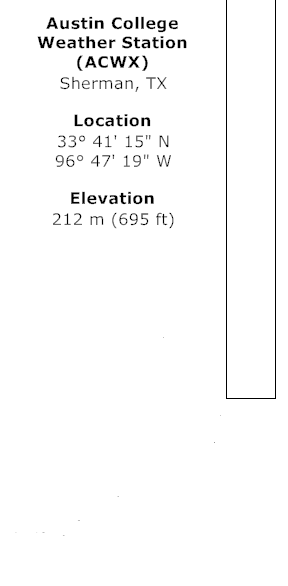
The Austin College Weather Station (ACWX) resides on the Sneed Environmental Research Area located 10 miles west of campus. Adjacent to the Hagerman National Wildlife Refuge, the Sneed property's 100 acres primarily function as an educational and research field area. One key research project at the Sneed Environmental Research Area involves restoration of previously farmed land to native prairie grassland. The Sneed Environmental Research Area is administered by the Austin College Center for Environmental Studies.
The Sneed Environmental Research Area is an excellent location for taking long-term meteorological and energy balance measurements. According to a soil survey by the US Department of Agriculture, soil at the Austin College Weather Station site is Wilson silty clay loam with roughly 30-40% clay. Clay soils are representative soil types in the region. Vegetation is predominantly a mixture of native and nonnative grasses with heights of roughly 0.1-1.0 meters. The closest property to the Austin College Weather Station is the Hagerman National Wildlife Refuge to the west. Thus, the likelihood of nearby development influencing long-term weather and climate observations remains small.
All ACWX standard meteorological measurements meet National Weather Service and Environmental Protection Agency requirements for fetch (distance from nearby obstacles). However, energy balance measurements (specifically air temperature at two levels and vapor pressure at two levels) impose much stricter requirements. With the upper arm of the Bowen Ratio System at 2.3-m height, the fetch requirement for these measurements is 230 m. This requirement is met in nearly all directions. A pond resides approximately 250 m to the north of the weather station. A stand of trees with heights of 3-10 m lies roughly 140 m to the east. South of the trees, a tool shed roughly 4-m high stands 180 m to the southeast of the weather station. A small stand of trees with heights of 3-6 m lies roughly 125 m to the southwest. A barbed wire fence located 50 m to the west separates the Sneed Environmental Research Area from the Hagerman National Wildlife Refuge, but this fence likely produces minimal effect on measurements.
Time
Austin College Weather Station (ACWX) measurements are recorded in Universal Time Coordinate (UTC), also known as Greenwich Mean Time or Zulu Time. Meteorological measurements around the world use UTC time to provide a common reference for surface and satellite observations. Local Standard Time (LST) for Sherman, Texas, is 6 hours earlier than UTC time. Local Daylight Time is 5 hours earlier than UTC time.
Depending on the instrument, ACWX sensors sample environmental observations at intervals ranging from 1 second to 20 minutes. Please refer to the Instrumentation Specifications table for the sampling rate for each individual sensor. The sampled observations are then averaged over a 20 minute period. The average measurements are reported on the Current Conditions web page, which is updated every 20 minutes as new average readings are calculated.
Meteorological Instrumentation and Measurements
Air Temperature: The Campbell Scientific HMP50 temperature and relative humidity probe contains a platinum resistance temperature (PRT) detector. The electrical resistance of the PRT varies with temperature; as the ambient temperature increases, the PRT internal resistance increases. PRT sensors are among the most stable and accurate temperature sensors on the market today. The Bowen Ratio System TCBR Thermocouples also measure air temperature at the Austin College Weather Station (see Air Temperature at Two Levels in the Energy Balance Instrumentation section). The HMP50 sensor was originally installed to test the Bowen Ratio System air temperature thermocouples and cooled mirror dew point measurements. It now serves as the primary temperature, relative humidity, and dew point sensor. Further details on the Bowen Ratio System are provided in the Energy Balance/Bowen Ratio Theory and Energy Balance Instrumentation sections.
Barometric Pressure: The Campbell Scientific CS105 barometric pressure sensor uses Vaisala's Barocap silicon capacitive pressure sensor. The CS105 sensor is an aneroid (without fluid) barometer in which pressure from the overlying atmosphere deflects a diaphragm, thereby altering the distance between the diaphragm and a nearby electrically capacitive plate. As atmospheric pressure increases, the distance between the diaphragm and plate decreases and the electrical capacitance increases. Aneroid barometers are less accurate than mercury barometers, but they are electronic and portable. ACWX barometric pressure observations have been corrected to sea level values (meteorological stations use sea level as a common reference height for pressure). The actual pressure at 700 ft above sea level is 25.4 mb (0.75 inches Hg) less than the reported value.
Dew Point Temperature: Dew point temperature is calculated from HMP50 temperature and relative humidity probe measurements. Further details can be found in Campbell Scientific's Technical Note Calculating Dew Point from RH and Air Temperature. The Bowen Ratio System 023A Cooled Mirror Hygrometer measures dew point temperature directly at two levels, but with less stability than the HMP50 calculated dew point temperature. Further details on the Bowen Ratio System are provided in the Energy Balance/Bowen Ratio Theory and Energy Balance Instrumentation sections.
Heat Index: Humid conditions reduce the human body's ability to cool effectively. The Heat Index estimates the temperature at 20% humidity that would affect the human body similarly to current temperature and humidity conditions. The Heat Index is calculated from HMP50 temperature and relative humidity probe measurements. ACWX Heat Index values are only reported from April to October. Further details can be found in Campbell Scientific's Heat Index Application Note.
Precipitation: The TE525 tipping bucket rain gauge manufactured by Texas Electronics records precipitation at the Austin College Weather Station. In a tipping bucket rain gauge, a pair of buckets rest on a pivot. When one bucket is full, it tips over and empties the accumulated water. As the first bucket tips, the other bucket moves into the "collecting" position. When this bucket is full, it tips over and the original bucket moves into the "collecting" position. Each tip of a bucket momentarily closes an electronic switch. The total number of tips is recorded during each 20 minute interval. A wind shield has been installed around the rain gauge to reduce evaporation of water in a partially filled bucket.
Wind Chill: The Wind Chill Index is a measure of the rate a human body loses heat. Typically, the body loses more heat during windy conditions due to smaller insulating boundary layers (layers of air with little or no motion) along the skin's surface. The Wind Chill Index estimates the temperature that would be required under calm wind conditions to achieve the same amount of heat loss under current conditions. The ACWX Wind Chill Index uses air temperature from HMP50 temperature and relative humidity probe and wind speed from the Wind Sentry Anemometer. ACWX Wind Chill values are only reported from November to March. Further details can be found in Campbell Scientific's Wind Chill Application Note.
Wind Speed: The 03001-5 Wind Sentry Set by RM Young Company measures horizontal wind speed at 3 meters above the surface with a 3-cup anemometer. A cup anemometer provides a simple, durable, and cost effective way of measuring wind speed. A constant wind results in a linear cup speed over a wide range of wind speeds. However, cup anemometers do not record low wind speeds (below 0.5 m/s or 1.1 mph) with accuracy. National Weather Service wind measurements occur at 10-m height above ground rather than at 3-m height. Thus, ACWX wind speeds are substantially lower than nearby National Weather Service observations. The wind speed at 10 meters depends on a variety of conditions (including time of day, weather conditions, and change of wind direction with height), so precise comparisons between 3-m measurements and 10-m measurements are extremely difficult. In general, wind speeds at 10-m height may be 10-20% larger during the day and 20-90% larger at night than 3-m height measurements.
Soil Instrumentation and Measurements
Soil Temperature:The Campbell Scientific TCAV Averaging Soil Thermocouple probe measures soil temperatures at 2 cm and 6 cm depth. Thermocouples consist of two different metals joined together to make an electrical circuit. Two junctions are present in a thermocouple: the first junction occurs where metal #1 connects with metal #2 and the second junction occurs further in the circuit where metal #2 reconnects to metal #1. If one junction has a different temperature than the other junction, a voltage difference forms between the two junctions and current flows in the circuit. Thermocouples are accurate, reliable, and economical. The TCAV probe utilizes type-E (chromel-constantan) thermocouples at 4 separate locations. Two thermocouples placed 1 meter apart record soil temperatures at 2 cm depth, while the other 2 thermocouples (again placed 1 meter apart) record soil temperatures at 6 cm depth. These four soil temperatures are averaged, thereby providing an average soil temperature in the upper 8 cm of soil. TCAV Thermocouple probe measurements are used to calculate stored energy in the upper 8 cm of soil for energy balance calculations.
Volumetric Soil Moisture: The Campbell Scientific CS615 Water Content Reflectometer measures volumetric soil moisture, the ratio of water volume to total volume of soil and water. The CS615 Water Content Reflectometer utilizes time domain reflectometry (TDR) to measure soil moisture. In TDR, an electromagnetic pulse is transmitted down a metal probe, or wave guide. Properties such as wave speed and wave frequency of the pulse depend on the dielectric constant of the medium that surrounds the probe. Since water has a significantly higher dielectric constant than dry soil, wet soils will produce slower pulse speeds (lower frequencies) than dry soils. Because soils with high clay content and organic material also affect TDR measurements, the CS615 Water Content Reflectometer has been calibrated for specific soils at the Austin College Weather Station site. The CS615 Water Content Reflectometer has two probes. At the Austin College Weather Station, one probe resides at 2.5 cm depth and the other probe resides at 5.7 cm depth. Together, the two probes estimate the water content in the upper 8 cm of soil. Dry soils will have volumetric soil moisture values below 0.15, and saturated soils will have volumetric soil moisture values above 0.40. Soil moisture measurements are used to estimate the soil heat capacity for soil energy storage calculations (see the Energy Balance/Bowen Ratio Theory section for more details).
Energy Balance/Bowen Ratio Theory
Energy balance at the Earth's surface largely controls the local climate. In the long term, the amount of energy reaching the surface must equal the amount of energy leaving the surface. If more energy reaches the surface than leaves the surface, the surface temperature will increase until energy input and output once again balance. Likewise, the surface temperature will decrease if more energy leaves than arrives at the surface.
Dominant sources of energy reaching the surface include solar radiation and infrared radiation from the atmosphere. Solar radiation drives the energy balance system. During daylight hours, the surface must adjust to the large input of energy from the Sun. Peak solar radiation occurs at roughly 12:30 PM Local Standard Time in Sherman, Texas. Infrared radiation from the atmosphere also provides a significant energy input to the surface. Any material with a nonzero temperature radiates electromagnetic energy. The Earth's lower atmosphere with temperatures of roughly -60°C to 40°C (-76°F to 104°F) emits radiation at infrared wavelengths. This infrared radiation from the atmosphere can amount to 40% of the peak summertime solar radiation.
Dominant sinks of energy include infrared radiation from the surface, sensible heat flux, latent heat flux, and heat transfer into the ground. Like the atmosphere, the Earth's surface emits radiation at infrared wavelengths. This radiation leaves the Earth's surface and either is absorbed by the atmosphere or escapes to space. Sensible heat flux involves the transfer of heat to the atmosphere either by conduction (transfer of energy by molecules bumping into one another) or by convection (transfer of energy through movement of large air parcels). Sensible heat is the heat you "feel". It can be detected visually on hot days as a shimmering, distorted layer of air near the surface. Latent heat flux is energy stored in evaporation of water. Evaporation of water requires a significant amount of energy (2.3 x 10⁶ J/kg). When water vapor condenses into liquid form, this latent energy is released. Evaporation of water removes energy from the surface, rising air transports water vapor into the atmosphere, and latent energy is released in the upper atmosphere when clouds form. Heat can also be transferred away from the surface into the ground by thermal conduction.
Of course, an energy flux that operates primarily as a source may also act as a sink under different conditions. For example, about 94% of solar radiation that reaches the surface is absorbed under normal conditions. However, ice reflects nearly all solar radiation that reaches the surface, and thus a surface with significant snow cover absorbs very little solar radiation. Similarly, latent heat flux usually transfers energy away from the surface through evaporation. However, latent heat flux transfers energy to the surface when dew forms in the early morning.
Partitioning of energy into its various forms reveals much about the local climate conditions. For example, strong sensible heat fluxes may indicate warm, dry surface conditions. Large (negative) latent heat fluxes may indicate wet soils. Negative values of net radiation (solar + infrared radiation) suggest radiative cooling at the surface under clear night skies. Rapid fluctuations in solar radiation may be caused by partly cloudy skies.
Energy balance measurements are relatively uncommon due to the necessity for extremely sensitive temperature and vapor pressure measurements. Currently, no National Weather Service weather sites make routine surface energy flux measurements. Such measurements are usually confined to special field projects with a duration of only a few months, or to highly maintained networks such as the Oklahoma Mesonet or the Atmospheric Radiation Measurement Program (ARM). Austin College is the only liberal arts college in the United States to measure the surface energy balance at a meteorological station.
The Austin College Weather Station measures the energy balance at the surface using an Energy Balance/Bowen Ratio (EBBR) technique. The Bowen ratio b is the ratio of sensible heat flux H and latent heat flux Le:
b = H / Le
In practice, the Bowen ratio is calculated by:
b = (p cp DT) / (l e De)
where p is atmospheric pressure, cp is specific heat of air at constant pressure, DT is the air temperature difference from two levels, l is the latent heat of vaporization, e is the ratio of the molecular weight of water to the molecular weight of dry air, and De is the vapor pressure difference from two levels. Thus, the Bowen ratio calculation needs pressure measurements, air temperature measurements at two levels, and vapor pressure measurements at two levels.
The EBBR technique assumes that energy is locally balanced at the surface at all times:
R + G + H + Le = 0
where R is net radiation (solar + infrared radiation) and G is ground heat flux. Positive values of energy flux indicate energy reaching the surface while negative values of energy flux indicate energy leaving the surface. Net radiation R is directly measured by the Q-7.1 Net Radiometer. The ground heat flux G consists of two components, the soil heat flux at 8 cm depth (Gf) and heat storage in the upper 8 cm of soil (Gs):
G = Gf + Gs
Gf is measured by two Hukseflux HFP01SC Heat Flux Plates, and Gs is calculated from soil temperature and soil moisture measurements:
Gs = (DTs Cs d) / Dt
where DTs is the soil temperature change over the last Dt seconds, Cs is the heat capacity of moist soil, and d is depth of the soil layer (8 cm). Soil moisture affects the value of Cs; larger values of soil moisture produce higher values of heat capacity.
Latent heat flux Le is then calculated from net radiation, ground heat flux, and the Bowen ratio:
Le = -(R + G) / (1 + b)
Sensible heat flux H is calculated from the energy balance assumption:
H = -(R + G + Le)
The EBBR technique for measuring surface heat fluxes does not require expensive vertical wind-speed measurements as does the eddy correlation method, another common technique for estimating energy fluxes. The necessary equipment for the EBBR method is relatively inexpensive. However, EBBR instrumentation must be frequently maintained and adjusted since very accurate measurements of air temperature and vapor pressure at two levels are required.
Further details on energy balance and the EBBR method can be found in Arya (2001), Oke (1987), Tindall and Kunkell (1999), and the Campbell Scientific Bowen Ratio System manual (please see the Additional Information section for full reference information).
Energy Balance Instrumentation and Measurements
SPECIAL NOTE: ONLY SOLAR RADIATION AND NET RADIATION ARE CONTINUOUSLY REPORTED ON THE ACWX CURRENT CONDITIONS WEB PAGE. BECAUSE OF SPECIAL MONITORING AND FREQUENT ADJUSTMENT REQUIRED OF THE COOLED MIRROR DEW POINT SENSOR IN THE 023A BOWEN RATIO SYSTEM, ENERGY BALANCE MEASUREMENTS ARE TAKEN ONLY DURING DESIGNATED FIELD EXPERIMENTS.
Solar Radiation: The LI200X Pyranometer by Li-Cor Biosciences measures incoming solar radiation at visible and near infrared wavelengths (400-1100 nm). It utilizes a silicon photovoltaic detector that generates electrical current when photons of light hit the surface (the photoelectric effect). Silicon photovoltaic pyranometers are less accurate than thermopile detectors (see the REBS Q-7.1 Net Radiometer in the Net Radiation section below), but are much less expensive and require less maintenance. At the top of the atmosphere and with the Sun directly overhead, the value of solar radiation is 1370 W/m2. Solar radiation values at the Austin College Weather Station can reach over 1000 W/m2 on clear summer days. Clear winter days measure roughly 600 W/m2 of peak solar radiation. Solar radiation measurements by the LI200X Pyranometer are not used directly in energy balance calculations, but can be used to estimate solar and infrared radiation contributions to net (total) radiation.
Net Radiation:The Q-7.1 Net Radiometer, manufactured by Radiation and Energy Balance Systems (REBS), measures the sum of incoming and outgoing net radiation at wavelengths of 0.25-60 mm. These wavelengths encompass ultraviolet, visible, and infrared radiation. Incoming radiation consists of direct and diffuse solar radiation plus long-wave (infrared) irradiance from the sky. Outgoing radiation consists of reflected solar radiation and long-wave radiation from the surface. The Q-7.1 Net Radiometer contains a thermopile of 60 thermocouples (see thermocouple description in the Air Temperature at Two Levels section below) attached to black surfaces which absorb all incident radiation. Temperatures of the black surfaces are compared with temperatures of nonabsorbing surfaces. The temperature differences (or equivalently, radiation differences) are converted to a voltage difference by the thermopile system. A polyethylene windshield protects the thermopile from debris and from convective cooling. Still, wind can reduce net radiation readings by introducing strong convective cooling. Net radiation observations are corrected using wind measurements from the RM Young 03001 Wind Sentry Set. Typical net radiation values at the Austin College Weather Station can reach 700 W/m2 on clear summer days. Winter daytime peak values are roughly 400 W/m2. Nighttime values may dip to -70 W/m2, which signify long-wave cooling at night. Positive values of net radiation indicate heat transfer toward the surface and negative values indicate heat transfer away from the surface. Net radiation is a key component of the energy balance at the surface. It usually functions as the primary input of energy at the surface during the day.
Ground Heat Flux: The ground heat flux is calculated from two components, a storage of energy in the upper 8 cm of soil and the flux of heat into the soil at 8 cm depth. The storage term is calculated from Soil Temperature and Soil Moisture measurements as described in the Energy Balance/Bowen Ratio Theory section. The heat flux term is measured by a HFP01SC Heat Flux Plate manufactured by Hukseflux. Heat transfer in the soil occurs primarily through conduction. Since the thermal conductivity of the plate and the plate thickness are known, the temperature difference across the plate is directly related to the conductive heat flux. The HFP01SC sensors measure the temperature difference across the plate using thermopiles (see Net Radiation section for a description of thermopiles) that convert the temperature difference signal into a voltage difference. The HFP01SC sensor utilizes self-calibration in which a fixed amount of heat is applied to the top of the plate for three minutes every two hours, making the HFP01SC sensor the most accurate heat flux sensor on the market. At the Austin College Weather Station, two HFP01SC Heat Flux Plates are installed 1 meter apart at 8 cm depth just below the TCAV Soil Thermocouples. The average heat flux of the two plates is used to calculate the total ground heat (storage + heat flux at 8 cm). Typical values of total ground heat flux range from -200 W/m2 (daytime) to +100 W/m2 (nighttime). Positive values of heat flux indicate heat transfer toward the surface and negative values indicate heat transfer away from the surface.
Air Temperature at Two Levels:The Energy Balance/Bowen Ratio technique requires air temperature measurements at two different levels (temperature difference) to calculate the Bowen ratio. At the Austin College Weather Station, one thermocouple resides at 1.3-m height and the other at 2.3-m height. The Campbell Scientific Bowen Ratio System utilizes two fine-wire chromel-constantan thermocouples (TCBR). Thermocouples consist of two different metals joined together to make an electrical circuit. Two junctions are present in a thermocouple: the first junction occurs where metal #1 connects with metal #2 and the second junction occurs further in the circuit where metal #2 reconnects to metal #1. If one junction has a different temperature than the other junction, a voltage difference forms between the two junctions and current flows in the circuit. Thermocouples are accurate, reliable, and economical. The TCBR thermocouples have higher resolution than the HMP50 air temperature measurements. Such accuracy is required since the temperature difference between the two levels is usually less than 0.5°C. The TCBR thermocouples are unaspirated and unshielded, and therefore may be susceptible to direct radiative heating. Since the temperature difference between the two levels is the important quantity, errors caused by radiative heating of each thermocouple tend to cancel.
Dew Point Temperature/Vapor Pressure at Two Levels: The Energy Balance/Bowen Ratio technique requires vapor pressure measurements at two different levels (1.3-m height and 2.3-m height) to calculate the Bowen ratio. The Campbell Scientific Bowen Ratio System utilizes the 023A Cooled Mirror Dew Point Hygrometer to measure the dew point temperature at two levels. Air samples from two heights are routed to a single cooled mirror. The mirror surface is cooled by a thermocouple heat pump. Formation of dew on the mirror alters the reflective properties of the mirror. Using an LED and optical photodetectors, the presence of dew on the mirror can be detected. A platinum resistance temperature (PRT) sensor then measures the temperature at which dew forms (see Air Temperature in the Meteorological Instrumentation and Measurements section for a discussion of PRT sensors). For two minutes, air from one height is drawn through the cooled mirror and the dew point temperature is measured. Air from the other height is then routed to the cooled mirror for the next two minutes. Many Bowen Ratio systems use two sensors to calculate dew point temperature at two levels. However, the position of the two sensors must be reversed periodically to cancel sensor biases. The use of a single chilled mirror instrument in the Campbell Scientific Bowen Ratio System eliminates these errors. Finally, the dew point temperatures are converted to vapor pressures needed for the Bowen ratio calculation. The 023A Cooled Mirror Dew Point Hygrometer has higher resolution than the HMP50 temperature and relative humidity sensor. Such accuracy is required since the dew point temperature difference between the two levels is often less than 1.0°C.
Bowen Ratio: The Bowen ratio is the ratio of sensible heat flux to latent heat flux. Under dry conditions, the Bowen ratio will be larger than 1.0. The Bowen ratio will be less than 1.0 (and likely less than 0.5) under wet conditions. With the Energy Balance/Bowen Ratio technique, the Bowen ratio is calculated from Barometric Pressure, Air Temperature Difference, and Vapor Pressure Difference measurements.
Latent Heat Flux: Latent heat flux represents the amount of energy (per second per unit area) stored in water vapor due to evapotranspiration from the surface. Latent heat fluxes are an important component of the surface energy balance. Under wet surface conditions, latent heat fluxes will be relatively large due to high evaporation rates. Under dry surface conditions, latent heat fluxes will be small (but sensible heat fluxes will be relatively large). In the Energy Balance/Bowen Ratio technique, latent heat fluxes are calculated from measurements of Net Radiation, Ground Heat Flux, and the Bowen ratio. Typical values of latent heat flux range from -400 W/m2 (daytime) to +100 W/m2 (nighttime). Positive values of heat flux indicate heat transfer toward the surface and negative values indicate heat transfer away from the surface.
Sensible Heat Flux: Sensible heat flux represents the amount of energy (per second per unit area) transported vertically from the surface by moving air. Warm, rising air near the surface corresponds to large sensible heat fluxes. Dry surface conditions produce relatively large sensible heat fluxes while wet surface conditions produce small sensible heat fluxes (but large latent heat fluxes). In the Energy Balance/Bowen Ratio technique, sensible heat fluxes are calculated from measurements of Net Radiation, Ground Heat Flux, and Latent Heat Flux. Typical values of sensible heat flux range from -300 W/m2 (daytime) to +100 W/m2 (nighttime). Positive values of heat flux indicate heat transfer toward the surface and negative values indicate heat transfer away from the surface.
Instrumentation Specifications
Instrument |
Range |
Accuracy |
Sensor Height |
Sampling Interval |
Averaging Interval |
| HMP50 - Temperature | -25°C - +60°C |
0.4°C at 20°C |
2.3 m |
10 s |
20 min |
| HMP50 - Relative Humidity | 0 - 98% |
3% |
2.3 m |
10 s |
20 min |
| HMP50 - Dew Point | -25°C - +60°C |
3.0°C |
2.3 m |
10 s |
20 min |
| CS105 Barometric Pressure | 600 - 1060 mb |
2 mb |
2.0 m |
10 s |
20 min |
| TE525 Rain Gauge | 3% |
0.5 m |
The total number of tips by the bucket are recorded
over a 20 minute period. |
||
| RM Young 03001-5 Wind Sentry Anemometer |
0 - 50 m/s |
2% |
3.0 m |
10 s |
20 min |
| RM Young 03001-5 Wind Sentry Vane | 0 - 360 degrees |
5 degrees |
3.0 m |
10 s |
20 min |
| TCAV Soil Thermocouple Probes | -2 cm & -6 cm |
10 s |
last 5 min of a 20 min period |
||
| CS615 Soil Water Content Reflectometer | 0.0 - 0.43 |
10% |
-2.5 cm |
20 min
|
20 min |
| LI200X Pyranometer | 5% |
3.0 m |
10 s |
20 min |
|
| REBS Q-7.1 Net Radiometer | 3% |
1.0 m |
10 s |
20 min |
|
| HFP01SC Soil Heat Flux Sensor | 3% |
-8 cm |
10 s |
20 min |
|
| Bowen Ratio System Fine Wire Thermocouples | 0.006°C |
1.3 m & 2.3 m |
1 s |
20 min |
|
| Bowen Ratio System 023A Cooled Mirror Dew Point Hygrometer - Dew Point |
0.003°C |
1.3 m & 2.3 m |
Every 1 s for two minutes at one height, then every
1 s for two minutes at the other height |
20 min |
|
Bowen Ratio System 023A Cooled Mirror Dew Point Hygrometer - Vapor Pressure |
0.01 kP
|
1.3 m & 2.3 m |
Every 1 s for two minutes at one height, then every
1 s for two minutes at the other height |
20 min |
|
Measurement Accuracy
Measurement or Calculated Quantity |
Accuracy |
| Meteorological | |
0.4°C at 20°C |
|
0.006°C |
|
|
2 mb |
3.0°C |
|
0.003°C |
|
|
1.2°C |
|
3% |
3% |
|
0.01 kP |
|
|
1.0°C |
|
5 degrees |
|
2% |
| Soil | |
|
|
|
10% |
| Energy Balance | |
|
0.2 |
|
5 W/m2 |
|
40 W/m2 |
|
3% |
|
40 W/m2 |
|
5% |
Power, Data Storage, and Telecommunications
Solar Power: The Austin College Weather Station runs on a 12-V deep cycle marine battery. The MSX20R Solar Panel manufactured by BP Solar charges the battery during daylight hours. Solar cells, or photovoltaic cells, are semiconductor devices that convert solar radiation into electricity. The MSX20R Solar Panel contains 36 multicrystalline photovoltaic cells to provide 20 watts of power. A voltage regulator prevents current flow from the battery to the solar panel and regulates current flow to the battery.
Datalogger: The Campbell Scientific CR23X Datalogger is a compact, portable datalogger that stores up to 1 MB of data. The CR23X Datalogger is housed in a weatherproof enclosure at the Austin College Weather Station site. The ACWX CR23X Datalogger has been specially programmed to record measurements from all ACWX instruments, to calculate derived quantities such as Heat Index and Wind Chill Index, and to communicate via modem with a personal computer on campus.
Telecommunications: The Austin College Weather Station has a dedicated land telephone line connected to a Campbell Scientific COM200 Landline Modem. A personal computer in the Moody Science Building on campus automatically downloads ACWX measurements every 20 minutes via modem. Campbell Scientific software on the personal computer processes the new data and produces an updated JPEG image containing Current Conditions for the Austin College Weather Station web site.
Additional Information
For further information on Austin College Weather Station specifics, please visit the Austin College Weather Station Overview web page or contact the Austin College Weather Station Director. Historical observations are available upon request.
Meteorological Instrumentation Vendors
- Campbell Scientific, Inc.
- Vaisala
- Texas Electronics
- RM Young Company
- Radiation and Energy Balance Systems, Inc.
- Li-Cor Biosciences
- Hukseflux Thermal Sensors
Books and Monographs
Ahrens, C. D. (2003): Meteorology Today, 7th edition, Brooks/Cole, 624 pp.
Arya, S. P. S. (2001): Introduction to Micrometeorology, 2nd edition, San Diego: Academic Press, 450 pp.
Brock, F. V. and S. J. Richardson (2001): Meteorological Measurement Systems, Oxford: Oxford University Press, 290 pp.
DeFelice, T. P. (1998): An Introduction to Meteorological Instrumentation and Measurement, Upper Saddle River, New Jersey: Prentice Hall, 229 pp.
Environmental Protection Agency (2000): Meteorological Monitoring Guidance for Regulatory Modeling Applications, EPA-454/R-99-005.
Hillel, D. (1998): Environmental Soil Physics, San Diego: Academic Press, 771 pp.
Houghton, J. T. (1986): The Physics of Atmospheres, 2nd edition, Cambridge: Cambridge University Press, 271 pp.
Moran, J. M. (2002): Online Weather Studies, Boston: American Meteorological Society, 416 pp.
Oke, T. R. (1987): Boundary Layer Climates, 2nd edition, London: Routledge, 435 pp.
Stull, R. B. (1988): An Introduction to Boundary Layer Meteorology, Boston: Kluwer Academic Publishers, 666 pp.
Tindell, J. A. and J. R. Kunkell (1999): Unsaturated Zone Hydrology for Scientists and Engineers, Upper Saddle River, New Jersey: Prentice Hall, 624 pp.
Wallace, J. M. and P. V. Hobbs (1977): Atmospheric Science - An Introductory Survey, New York: Academic Press, 467 pp.